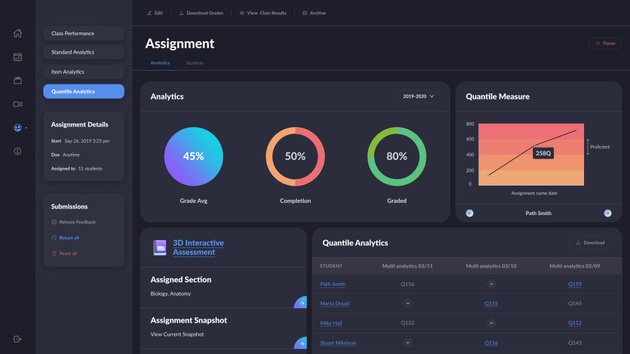
We took the most popular K-12 EdTech classroom and compared their reporting features. This research was for our inner use at first. But we thought you’d like it too.
First, let’s see what we were looking for.
What you should know about LMS analytics reporting
When you start comparing different LMS reporting features, it can quickly get confusing. Someone new to EdTech wouldn’t know what to look for. But it’s not so complicated.
Here are the main questions to ask:
- Does it support experience tracking?
- What can the LMS report card tell you?
- How expensive is it?
Does it support experience tracking: xAPI & Caliper?
Without experience tracking, you will have pretty basic analytics. This is the first thing to check when comparing dashboards in LMSs.
If you don’t know what it is, we have an article that explains experience tracking standards like xAPI, Caliper, or SCORM. Take a look at it for an in-depth guide.
But here’s the main idea.
Fifteen years ago, there was SCORM. Learning analytics was basic. If your LMS supported SCORM, you could check simple progress data about your students.
The analytics were only collected from browser LMS. Mobile apps weren’t around yet, neither were AR, VR, or simulations.
Interestingly, many years ago all LMS assignments had to be passed online. If students lost internet access during the test, they had to start over.
All you could analyze were:
- Grades;
- Progress and completion;
- Attendance.
Not bad, but also not very in-depth.
Today, we have xAPI and Caliper. With these specifications, you can analyze data about any student action. Mobile or desktop, offline or online.
eLearning developed a lot over the years. K-12 schools have videos, simulations, and learning games. But how do you check student progress there? SCORM is not going to help much, but xAPI and Caliper analytics will.
Here are the types of things you can check today:
- At which moments do students pause or rewind a video?
- Has a student opened new browser tabs while passing an online test?
- Did a surgery student make the correct incision in a VR simulator?
Anything students do can be analyzed. So, if you want in-depth reports, make sure that the LMS supports xAPI or Caliper Analytics.
xAPI and Caliper are very similar technically. Caliper is made for perfect LTI compliance. Meanwhile, xAPI is the successor of SCORM.
Some apps only support xAPI, while others have Caliper. If your LMS supports both, you can integrate more games and tools into your ecosystem.
What Can the LMS Report Card Tell K-12 Educators?
Let’s say you’ve collected a lot of student experience data. You have a spreadsheet that keeps history about all the log-ins, course views, grades, and so on.
What are you going to do with this data? It’s not processed yet, so it’s hard to make sense of.
The LMS should have a good way of displaying the information. Charts, tables, filters, and reports should give you a 360 understanding of your system.
Here’s what you can expect from a robust LMS:
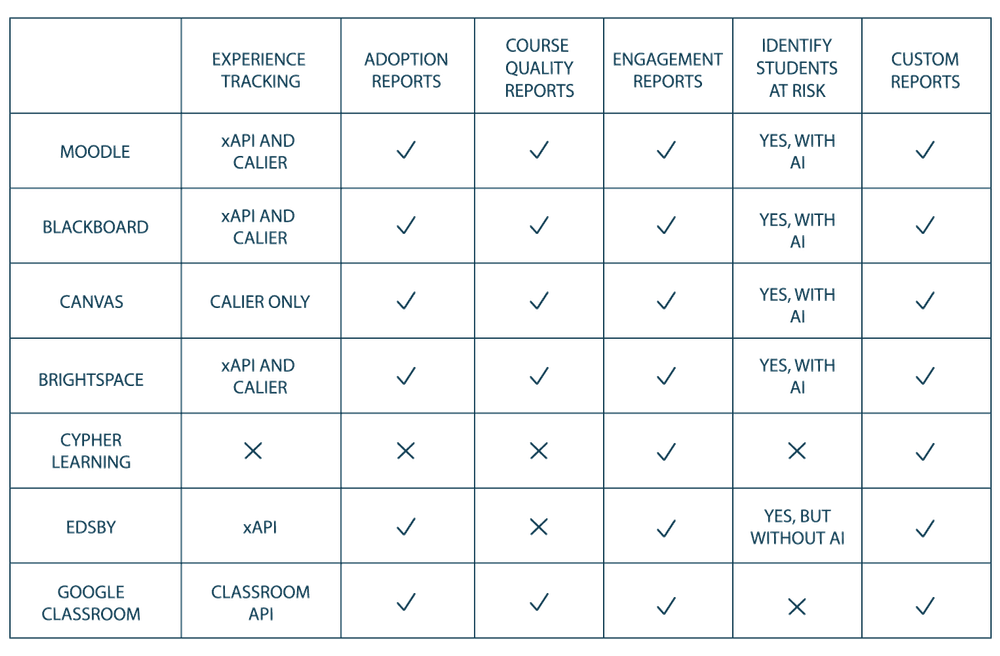
- Adoption Reports to understand your investments. K-12 schools can buy lots of software. Adoption reports show which of the tools actually help your students grow. Track course enrollments and see how often the learning tools are accessed.
- Check course quality. Design better courses and see how content correlates with engagement and grades. See which parts of the content are skipped through or paused.
- Understand the learners. Identify at-risk and exceptional students. Learn what drives their performance. Compare grades with district results. Track last course access, assignment completions, or time spent consuming content.
- Use AI tools that analyze student performance.
- Personalized learning programs with AI. Analyze student performance and create optimal learning paths. Monitor performance to locate at-risk students.
- Create custom reports and AI models. Get customized data and charts.
Whether you are a school administrator, educator, or content provider, you can use analytics to your advantage.
So let’s see what different LMS have to offer.
Moodle
Does the LMS Support Experience Tracking?
Yes, both xAPI and Caliper.
What’s Special About the Dashboards & Reports?
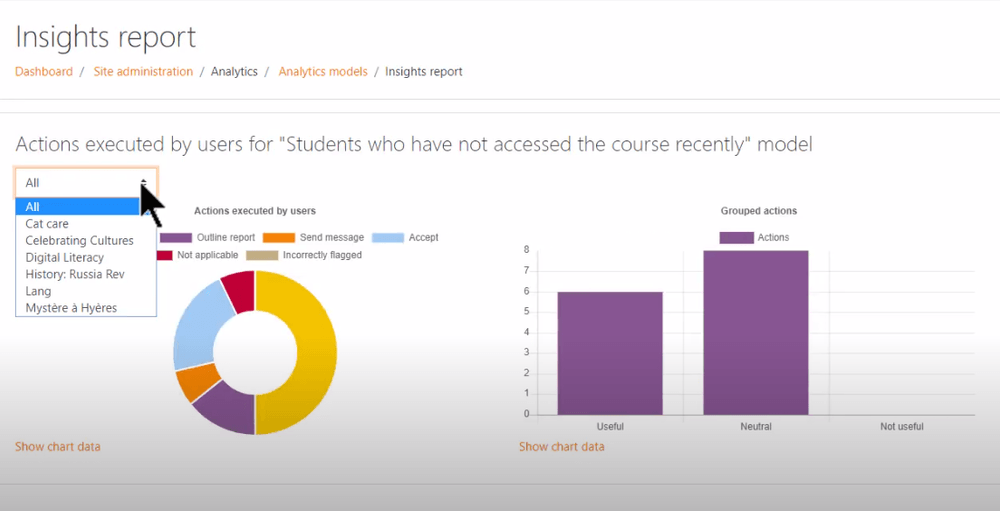
AI tools to Identify students at risk. The model analyzes 42 parameters that can be grouped in the following categories:
- Cognitive presence;
- Social presence;
- Teacher presence.
Custom AI models. In most LMS you can create custom reports and graphs. In Moodle you can also create custom machine learning models. Everything can be visualized, too.
Free plugins. Since Moodle is open source, you can find free community-made analytics plugins.
What About the Pricing Model?
Moodle doesn’t charge you extra for analytics. But if you’re serious about dashboards, take a look at the Moodle plugins. You’ll find different options with pricing ranging from free to thousands of dollars.
Blackboard
Does the LMS Support Experience Tracking?
Yes, both xAPI and Caliper.
What’s Special About the Dashboards & Reports?
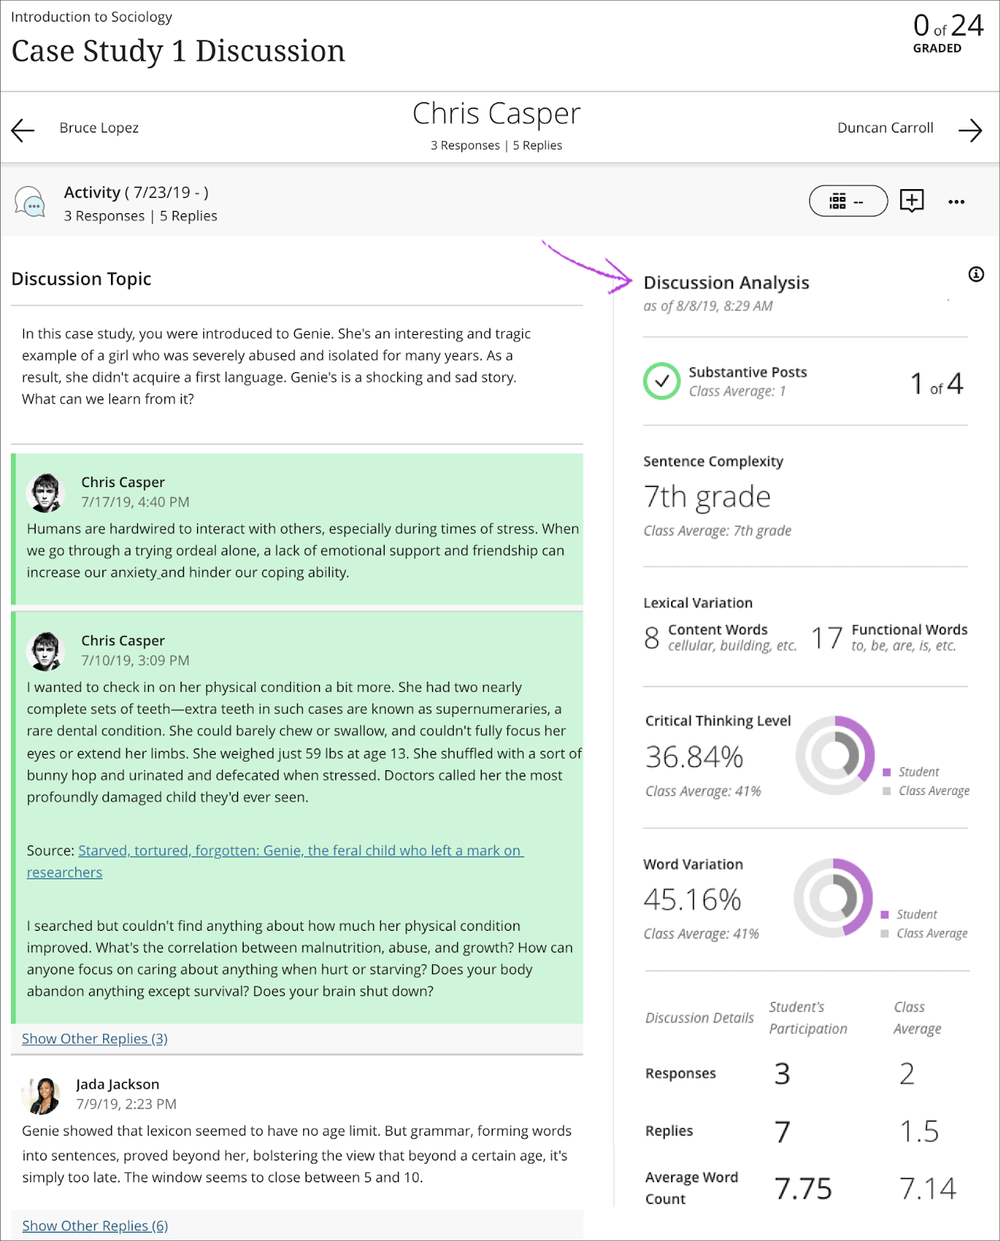
Straightforward experience. While Moodle has lots of plugins to choose from, Blackboard offers you a direct solution. You’ll have strong analytic tools out of the box. Provided, you’re on the Blackboard Ultra plan, of course.
AI models to identify at-risk students. Student risk is divided into 4 categories:
- Missed Deadlines;
- Grades;
- Course Activity;
- Course Access.
What About the Pricing Model?
All the analytics comes as standalone add-ons. There’s a module for analyzing your return on investment, one for tracking student performance, and so on.
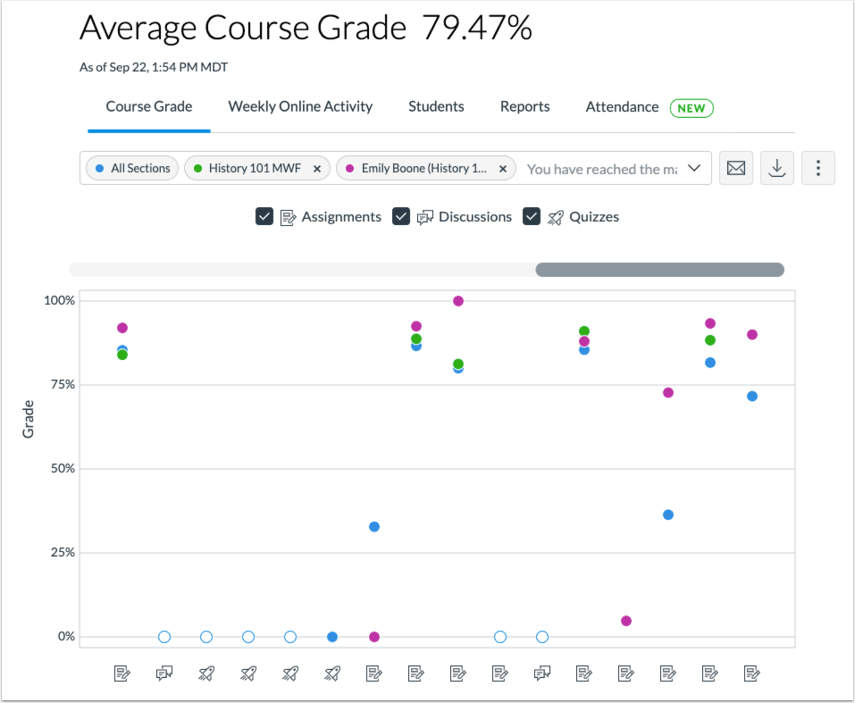
Canvas
Does the LMS Support Experience Tracking?
Yes, but only Caliper. If you need xAPI and LRS support, look for other options.
What’s Special About the Dashboards & Reports?
Fewer analytic tools. Don’t get us wrong, Canvas has a robust analytics bundle. Most of the features you’ll need, you’ll find here.
But we didn’t find anything outstanding, like predictive AI analytics. What you can find in Canvas, you can find in other LMS as well.
Identify at risk students. Canvas doesn’t have a predictive AI model, but you can still compare a student with the class average or district average. Here’s what it takes into account:
- Activity by date;
- Submissions;
- Grades.
What About the Pricing Model?
To get the best analytics capabilities, you’ll need to purchase Elevate K-12 Analytics. A single app keeps data from all of your tools.
Without Elevate, you’ll still have Analytics and New Analytics.
Where Can I Learn More?
Read about Analytics or check out Elevate for K-12.
brightspace
D2L Brightspace
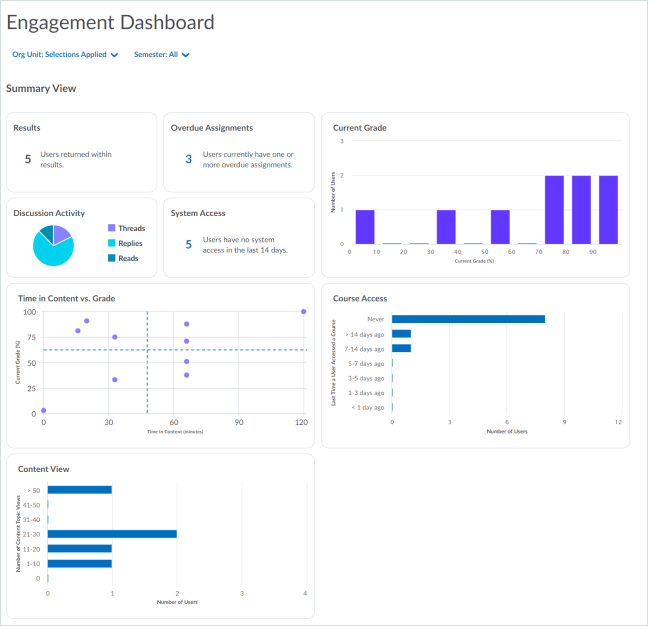
Does the LMS Support Experience Tracking?
Yes, both xAPI and Caliper Analytics.
What’s Special About the Dashboards & Reports?
Brightspace offers many different dashboards tailored for administrators, educators, and learners. This chart by D2L shows it best:
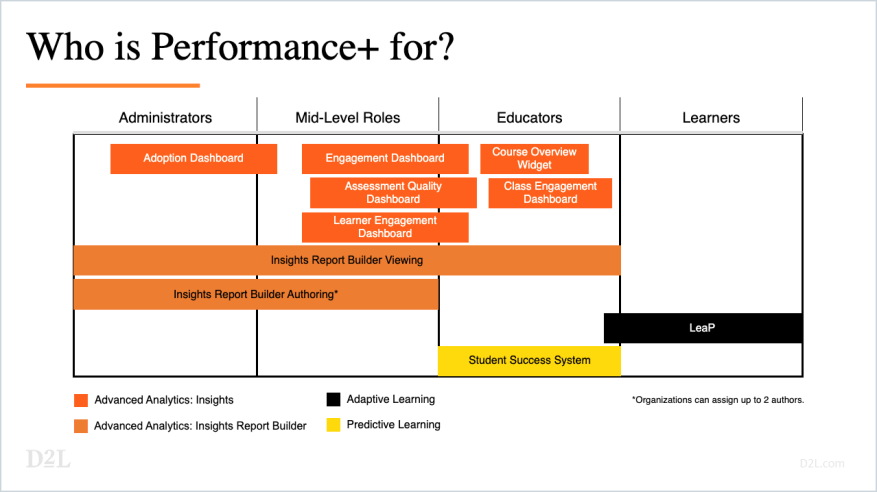
AI models to Identify at-risk students. Brightspace’s predictive learning model looks at student grades to create a success index. With it you can track student performance, and intervene early on.
What About the Pricing Model?
For advanced analytics, you’ll need to get Performance+, an extra analytics plan.
Cypher LMS
Does the LMS Support Experience Tracking?
No.
What’s Special About the Dashboards & Reports?
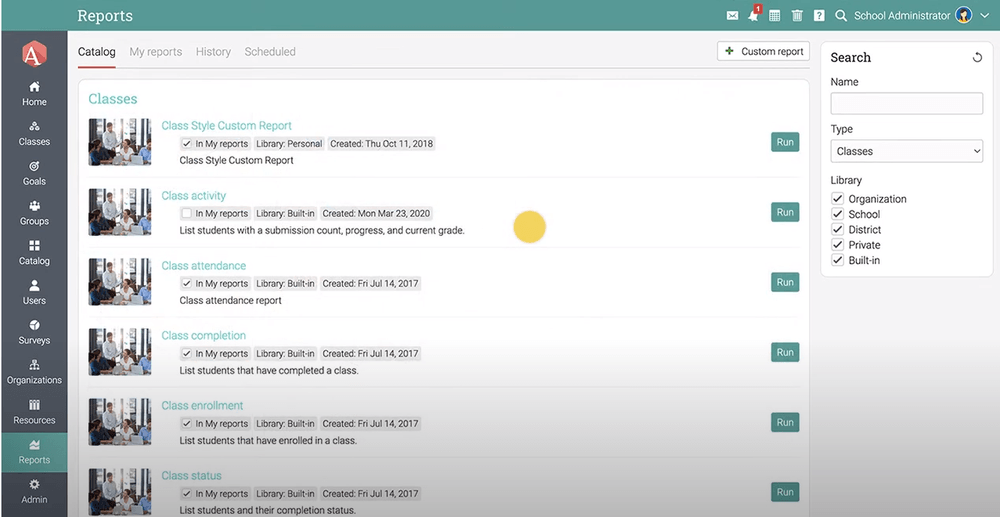
Track results, not experiences. Without xAPI or Caliper, the analytics is going to be quite simple. You won’t have reports analyzing quiz answers or student writing levels.
Instead of student experience, Cypher analyzes results. Get reports on metrics like logins, enrollments, or assessment results.
Reports, not dashboards. Dashboards show the basic details. For complex charts, you’ll have to manually run reports. Such reports you can customize, download in multiple formats or send via email.
What About the Pricing Model?
Cypher doesn’t have standalone analytics software. So, once you buy the LMS you’ll have all the analytics it has to offer.
Edsby LMS
Does the LMS Support Experience Tracking?
Yes, Edsby says that the platform is both xAPI and Caliper-ready. The official xAPI page doesn’t mention Edsby, but maybe they just need to update that.
What’s Special About the Dashboards & Reports?
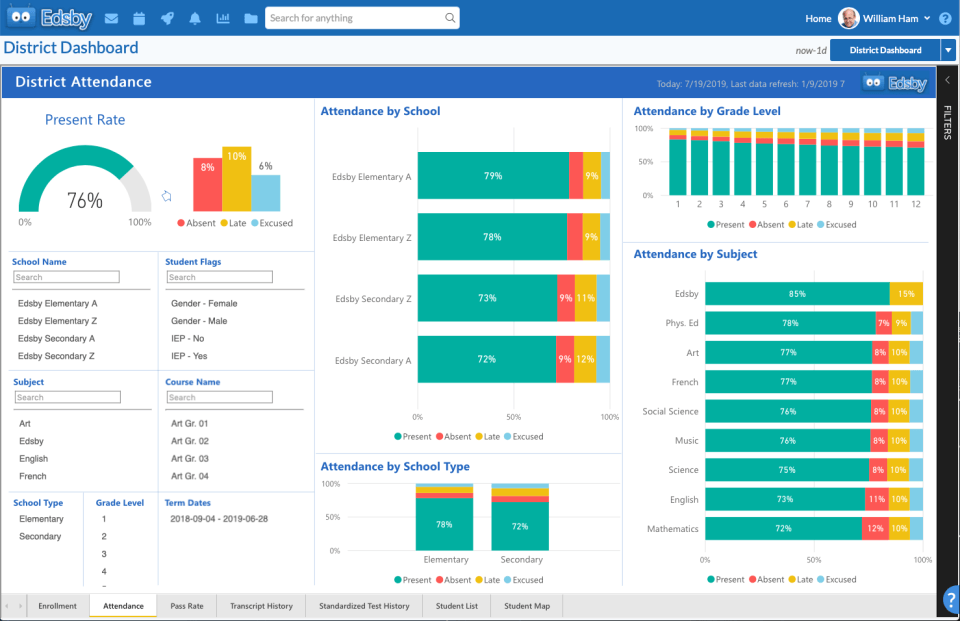
Powerful dashboards. Edsby packs lots of visual data in the dashboards. You’ll get a good grasp of student performance from each page. Just look at the District attendance dashboard above.
Identify students at risk. Without predictive AI, Edsby still highlights at-risk students. The risk indicators are:
- Failing classes;
- Attendance;
- Teacher’s suggestions.
What About the Pricing Model?
Edsby offers a standalone product called Advanced Analytics.
Google Classroom
Does the LMS Support Experience Tracking?
Yes, but Google does it their way. Instead of xAPI or Caliper, Google has a custom experience API.
What Dashboards & Reports Do You Get?
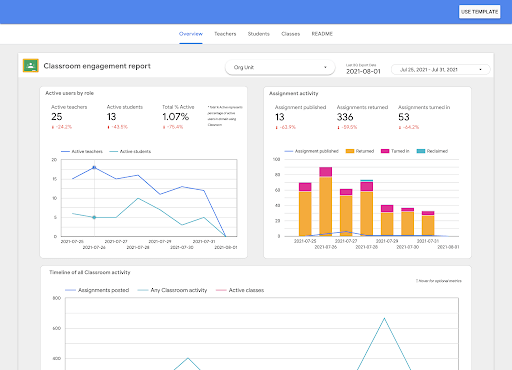
Weaker reports, for now. At the moment, the analytics don’t show assignment completion, grades, or adoption. But Google announced advanced analytics for the Education Plus package. When released, the reports should get much better.
Understand student engagement. For now, the analytics is focused on user engagement. The teachers can check student activity in different assignments and see trends.
What About the Pricing Model?
When Google upgrades the analytics features, they will be on the Education Plus package. But you can also get analytics with 3rd party tools.
How to get the most of LMS analytics
If you want to finetune analytics in your LMS, reach out. We can install modules, or integrate your LMS with 3rd party analytics software. We can also find you the right LMS for your needs.
For 10 years in the K-12 EdTech market, we’ve helped over 40 clients handle millions of students. Let us help you too.

