How we made an AI assistant for analytical dashboards in 3 months
The client is a mid-sized US logistics company that provides order fulfillment as well as warehousing and storage, picking and packing, and shipping services.

Key achievements
| 90% | and more accuracy in interpreting user queries |
| 50% | faster insight generation |
| 40% | increase in dashboard active users |
Solution requirements
Firstly,
the AI assistant for analytical dashboards has to allow users to formulate regular questions in a regular manner, which means to understand human-like input.
Secondly,
it should be able to maintain at least 90% accuracy in correctly interpreting queries and providing text and graphic responses that make use of all the dashboards’ data and its correlations.
Finally,
the system should handle a large number of users simultaneously.
How we did it
First, we checked the client’s data for quantity, quality and regularity to comprehend that the project is feasible and the client can expect the desired outcome.
We also talked to various business representatives to gather the most common requests and pain points.
The quality and quantity of clients’ data were satisfactory. Therefore, we took several dashboards that contained company annual reports, examined the data, and trained LLM to provide answers based on them.
The final LLM choice was GPT 4o, because it showed the best quality and speed in giving answers to human-like questions among other candidates.
Next, we measured the accuracy of the LLM-provided query responses by comparing them to the desired results.
The PoC was presented and the client was highly satisfied. Therefore, it was decided to scale the success.
We continued training an AI assistant on all available dashboards, and planning the solution integration with the client’s corporate system.
Data collection pipeline
We built a data collection pipeline that detects changes in the database data. This is to ensure that when a new dashboard appears, the metadata—which explains what is stored in the table—is parsed and the information is added to the LLM.
Solution pipeline
The solution pipeline involved applying the NLSQL method. It is used to process any complexity of human questions and transform them into SQL requests and back.
The biggest challenge was the incompleteness of some of the dashboards metadata. Yet, we managed to explain to the LLM their contents through a large number of experiments (adding metadata, or writing cleverly constructed prompts).
Project duration:
The quality and quantity of clients’ data were good enough to enable quick development. Therefore, the project lasted approximately 3 months.
Backend and Frontend
Meanwhile, frontend developers were busy building a user-friendly interface, and backend developers conducted APIs creation to integrate the AI assistant smoothly into the client’s corporate system.
Performance monitoring
Finally, we verified the accuracy, usability, and functionality through performance monitoring and testing with real users.
User training
We also prepared comprehensive instructions, trained the C-level and management representatives to use the AI assistant efficiently and pass on knowledge to their team members.
How it works
An AI assistant for analytical dashboards is integrated with the client’s corporate system for efficient data search. This is how it’s used:
A user logs into the company’s corporate system.
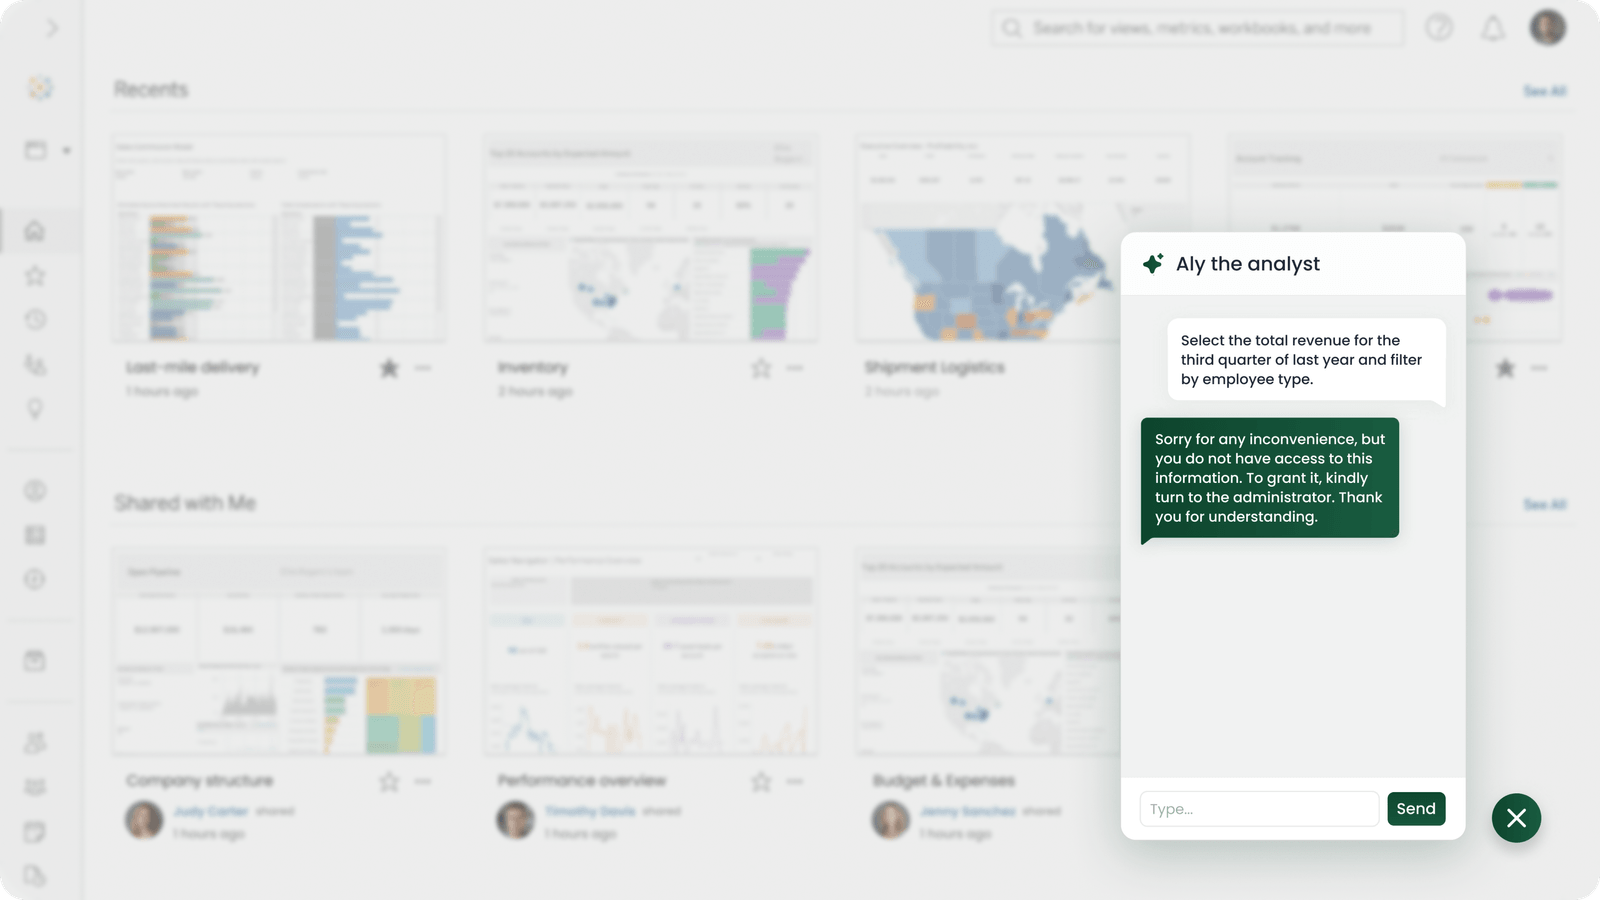
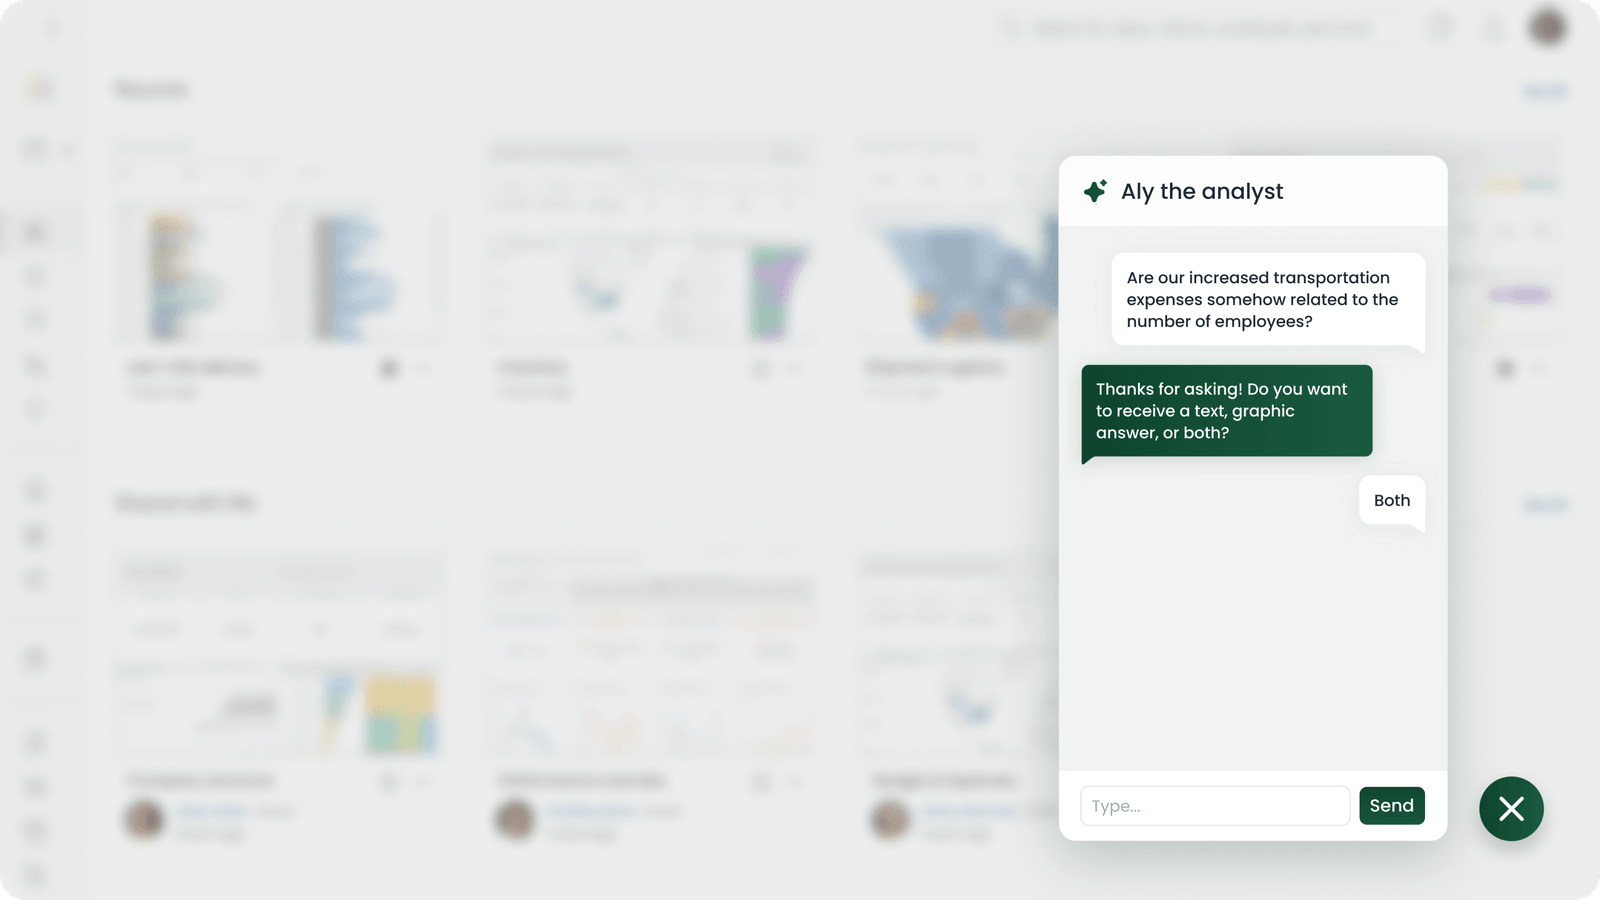
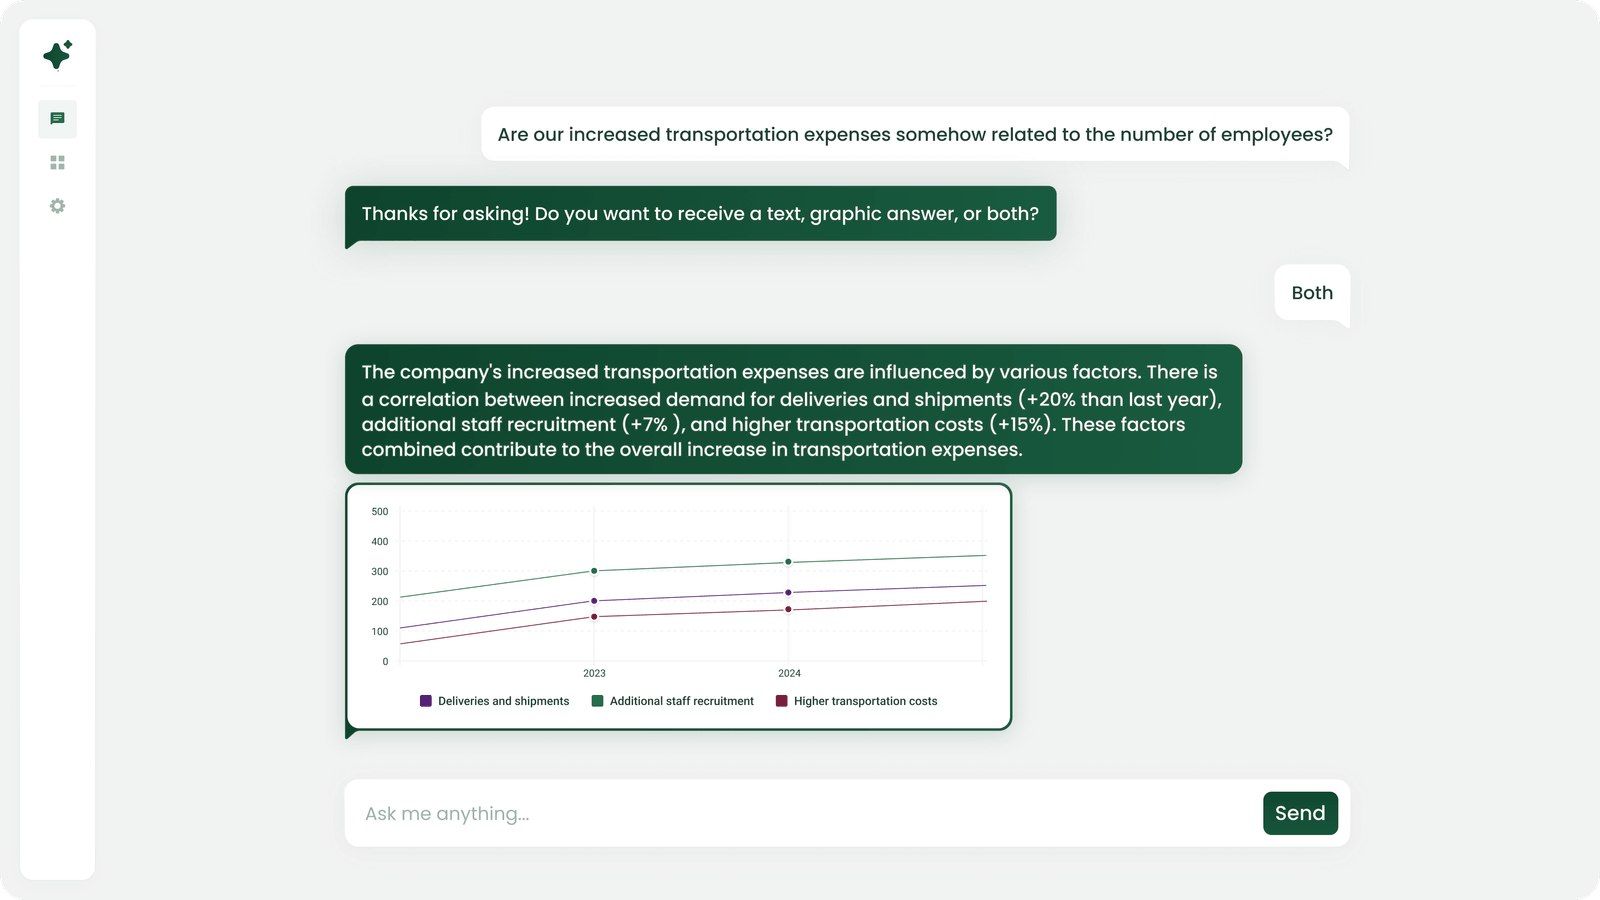
In the right corner of the webpage, there’s a chat window. The user can enter a query in a free form there or make it full screen.
The AI assistant determines the user access level and retrieves the data allowed to view.
Then it processes the request, clarifies the required answer format—text, graphical form, or both options.
As a result, the solution generates a comprehensive response based on the available data.


